Volume Illusions: Unmasking the Wash Trading and Market Maker Games Behind Crypto's Most Misleading Metric
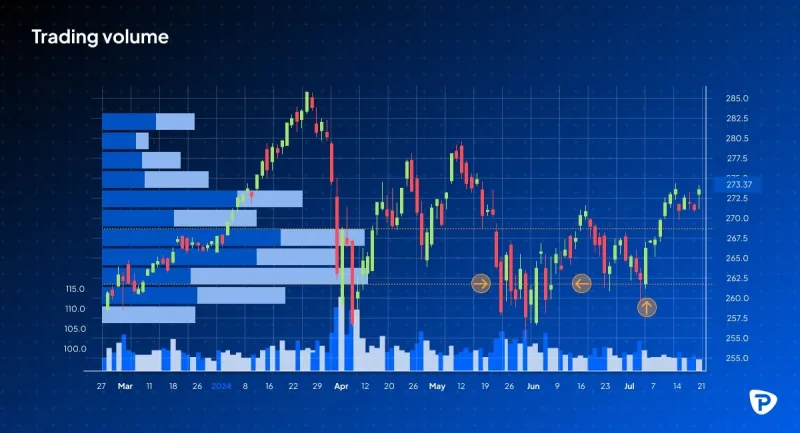
Photo: cryptocurrency trading volume chart analysis data manipulation, via eu-images.contentstack.com
When a new token appears on a major aggregator showing $40 million in daily trading volume, the instinct for most investors is to interpret that figure as a signal of legitimate market interest. Volume, after all, implies demand. It implies liquidity. It implies that other humans — real ones, with real capital — are buying and selling that asset.
That instinct, unfortunately, is frequently wrong.
In cryptocurrency markets, trading volume is among the most manipulated data points in existence. Unlike equities markets regulated by the SEC, where wash trading carries serious legal consequences, large portions of the crypto ecosystem operate in jurisdictions — or through mechanisms — that make artificial volume generation not just possible, but common. Understanding this problem is not optional for serious traders. It is a prerequisite for survival.
What Wash Trading Actually Looks Like on the Chain
Wash trading occurs when a single entity — or a coordinated group — simultaneously buys and sells the same asset to generate the appearance of activity. In traditional finance, this is a textbook form of market manipulation. In crypto, it is disturbingly routine.
The mechanics vary by sophistication. At the simplest level, a project team or affiliated wallet will transfer tokens between two wallets they control, recording each transfer as a "trade" on a decentralized exchange. The volume counter climbs. No external capital changes hands. No genuine price discovery occurs.
More advanced operations involve automated bots cycling assets through multiple wallets in rapid succession, deliberately obscuring the circular flow of funds. These patterns can be difficult to detect at a glance, but on-chain analysis tools such as Nansen, Chainalysis, and Dune Analytics dashboards can reveal telltale signs: wallets that consistently appear on both sides of large trades, transaction timing that is too uniform to reflect organic behavior, and wallet clusters that share funding sources.
On centralized exchanges, the problem is compounded by the fact that off-chain order books are not publicly auditable. A number of smaller centralized exchanges have historically reported volumes that bear no relationship to their actual user base or order depth — a pattern documented repeatedly by research firms including Bitwise Asset Management, which published a landmark report in 2019 estimating that over 95 percent of reported Bitcoin trading volume on unregulated exchanges was fabricated.
Market Maker Incentive Structures: When Liquidity Becomes a Performance
Beyond outright wash trading, a subtler form of volume inflation emerges from market maker agreements that incentivize activity rather than genuine liquidity provision.
Many token projects — particularly at the small- and mid-cap level — hire market making firms under contracts that tie compensation to volume thresholds. The perverse outcome is predictable: market makers generate circular trading activity to meet contractual minimums, collecting fees while providing only the illusion of a healthy order book.
This arrangement can be especially damaging during periods of genuine selling pressure. When a token experiences real distribution from early holders or venture capital firms exercising unlock provisions, the artificial volume disappears precisely when real liquidity is needed most. Traders who entered a position based on what appeared to be robust market depth suddenly find themselves holding an asset with no meaningful exit.
Practical Signals That Separate Real Volume From Fabricated Activity
Identifying phantom liquidity requires moving beyond headline volume figures and examining the underlying structure of market activity. Several reliable diagnostic approaches exist for traders willing to do the work.
Order book depth analysis. Genuine liquidity manifests as meaningful bid and ask volume within one to two percent of the current price. A token showing $10 million in daily volume but only $50,000 in visible order book depth is almost certainly experiencing artificially inflated activity. Most professional trading terminals and aggregators provide this data.
Volume-to-market-cap ratio outliers. When a token's daily trading volume consistently exceeds its total market capitalization — or represents an implausibly high percentage of it — that is a statistical red flag. Organic market activity rarely produces ratios this extreme for extended periods.
Wallet concentration on DEX trades. Using tools like Dune Analytics or DEXScreener, traders can examine what percentage of a token's on-chain volume originates from a small number of wallet addresses. When ten or fewer wallets account for the majority of trade activity, the volume is almost certainly not organic.
Time-of-day uniformity. Human trading is messy and irregular. Bot-driven wash trading tends to be consistent across all hours, including periods when the token's presumed user base would logically be asleep. Uniform hourly volume distribution across a 24-hour window is a meaningful warning sign.
Cross-exchange discrepancies. When a token shows dramatically different volume figures across exchanges that should be arbitraged into alignment, it suggests that volume on at least one of those venues is not reflecting genuine market forces.
The Aggregator Problem
A structural challenge compounding this issue is that the most widely used data aggregators — platforms that retail traders rely on for quick market assessments — have historically been slow to filter out manipulated volume. Some aggregators apply adjustments or confidence scores to reported figures, but these methodologies are not standardized and vary considerably in rigor.
For US-based traders, this matters practically. Many investment decisions — including decisions about which tokens to research further, which to add to watchlists, and which to dismiss — are made in seconds based on aggregator data. When that data is corrupted at the source, the downstream decisions are built on sand.
Several more rigorous data providers have emerged to address this gap, applying statistical filters that downweight or exclude exchanges exhibiting suspicious patterns. Consulting multiple data sources, particularly those that disclose their volume adjustment methodologies, is a prudent standard practice.
Building a Healthier Due Diligence Habit
The phantom liquidity problem is not going away in the near term. Regulatory clarity around wash trading in crypto markets is still evolving in the United States, and enforcement actions, while increasing, remain inconsistent across jurisdictions.
What traders can control is their own framework for evaluating market activity. Treating volume as a single authoritative number — rather than as a figure requiring triangulation with depth data, wallet behavior, and cross-platform comparison — is a habit that serves the projects inflating their metrics far more than it serves the investors trying to navigate them.
At BTC Token Off, our consistent position is that the sophistication of a trader's analytical process is the most durable edge available in a market where raw data cannot be taken at face value. Volume is not evidence of legitimacy. Verified, multi-source, structurally coherent activity is.
The distinction is worth understanding before the next eye-catching volume figure sends you in the wrong direction.